What is MINITAB ?
3 January 2020
Minitab can visualize, analyze and harness the power of your data to solve your toughest challenges. Now from anywhere on the cloud.
Minitab has the market’s most trusted statistical tools to get the most out of your data, discover trends, predict patterns, uncover hidden relationships between variables, visualize data interactions and identify important factors to answer even the most challenging of questions. Enjoy new levels of productivity and collaboration with Minitab now accessible through both your desktop and on the cloud with our new web app. With the power of statistics and data analysis on your side and accessible from anywhere, the possibilities are truly endless
.png)
Discover :
Make better data-driven decisions at anytime from anywhere. Our highly reputable and robust data analysis tool has an easy-to-use and intuitive interface for both new and seasoned users alike.
- Greater Opportunities and Decision-Making Capabilities Project better outcomes, design better products, improve processes and feel empowered by your data, regardless of your statistical background.
- Drive Business Excellence Only Minitab offers a unique, integrated approach by providing software and services that drive business excellence now from anywhere thanks to the cloud.
.png)
Predict:
Business is ever evolving. Look further into your future and forecast trends to make better decisions, eliminate unnecessary costs and stop mistakes before they happen.
- Dive Deep in Your Data Access modern data analysis and our advanced analytics tools like factor analysis and cluster variables.
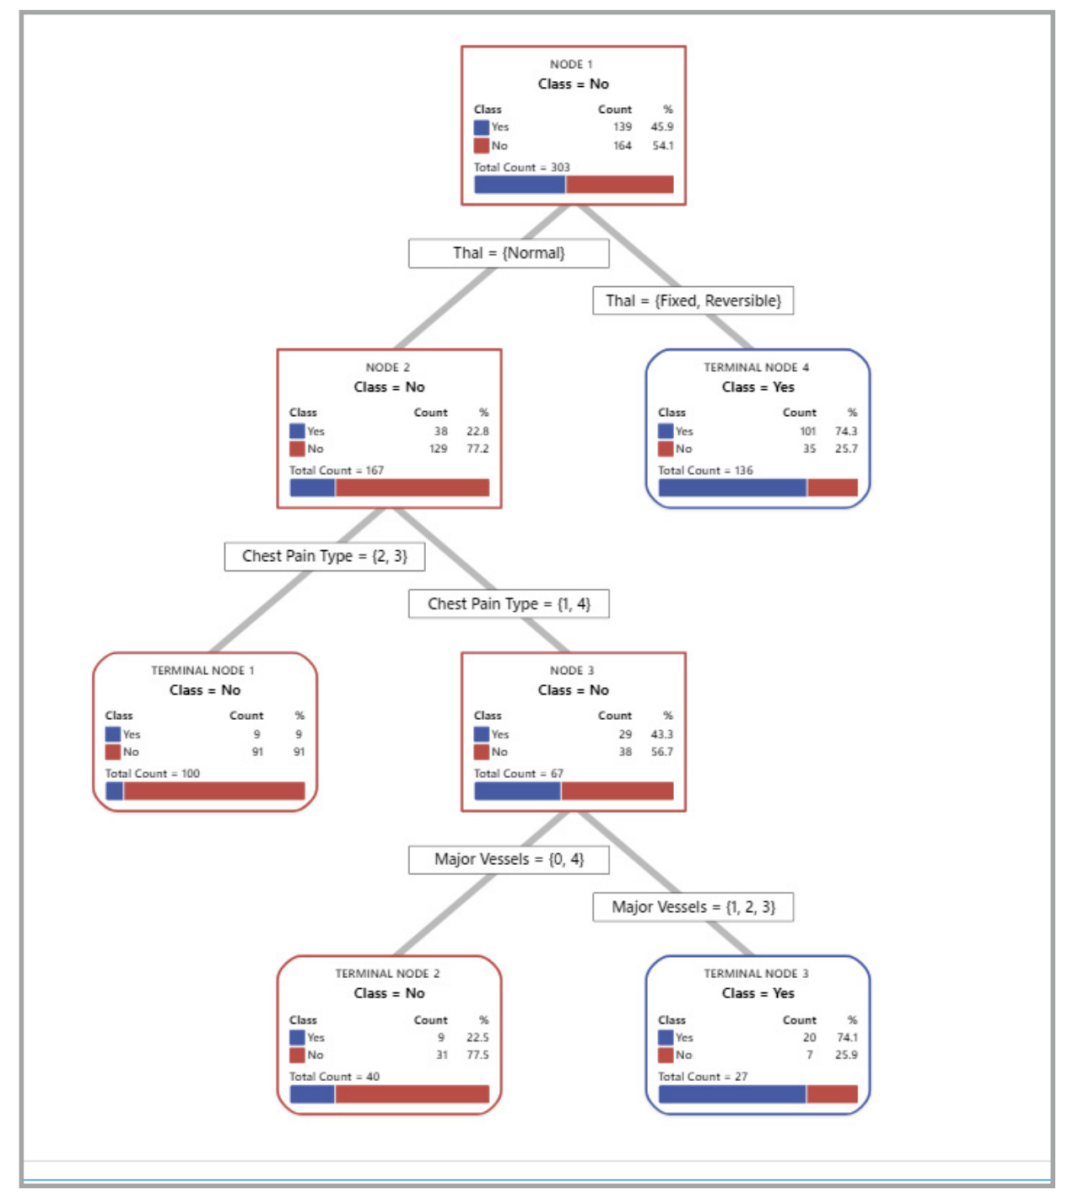
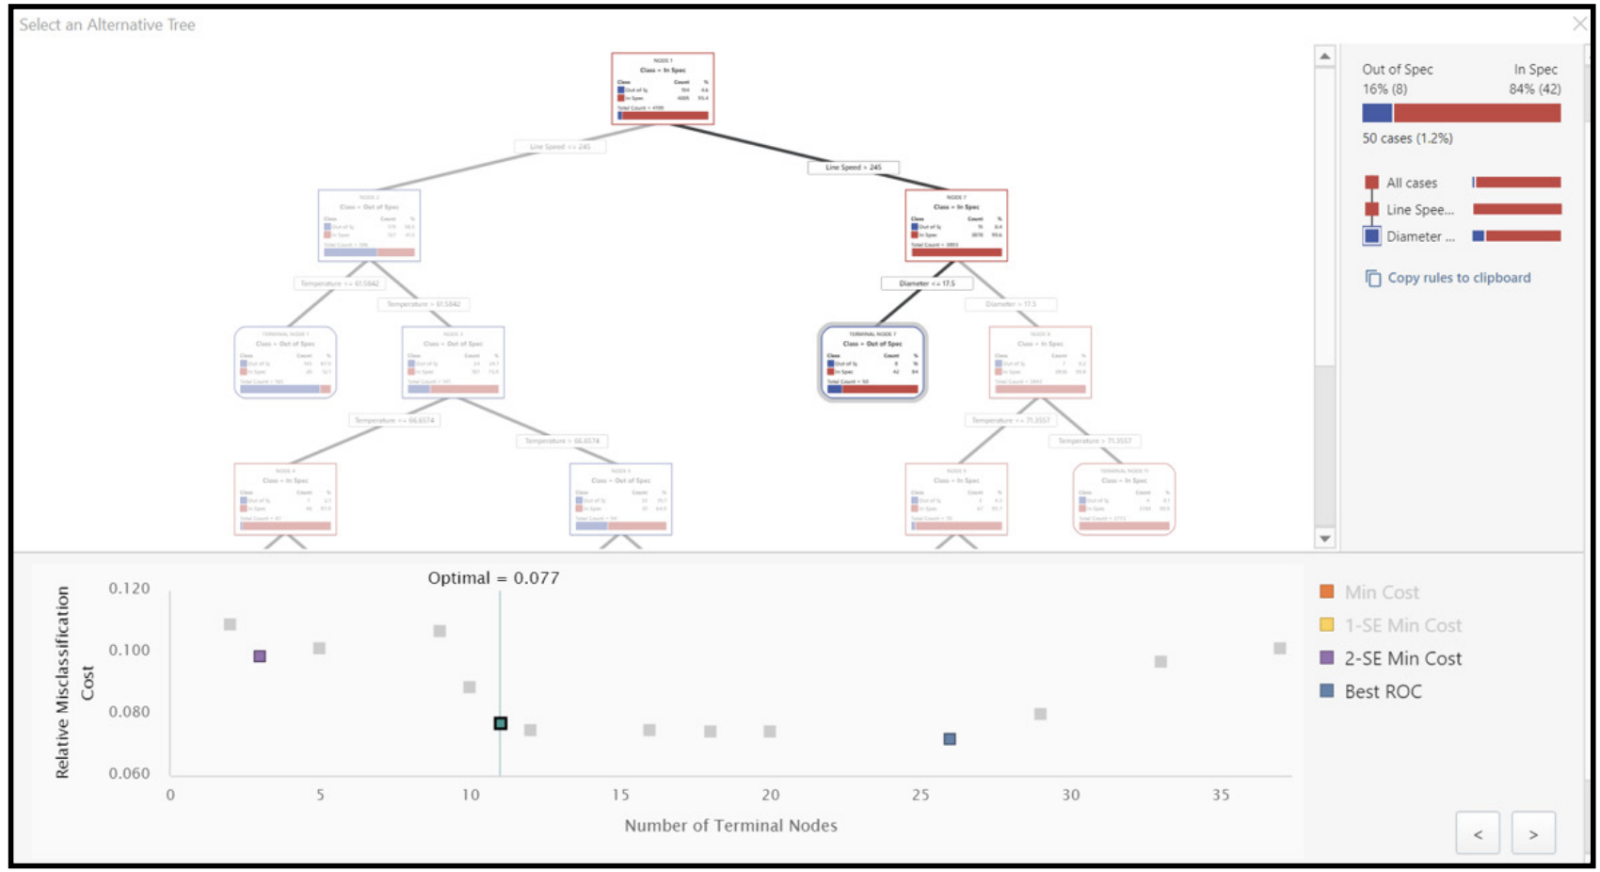
- Forecast Your Business Expertly predict with our revolutionary machine learning techniques like Classification and Regressions Trees (CART®), Poisson regression and logistic regression.
- Tap Into the Analytics Community Our Python integration unites call scripts with your Minitab data and analysis thanks to open source integration. Work more closely with data scientists and macros to expand your analytical capabilities
Achieve:
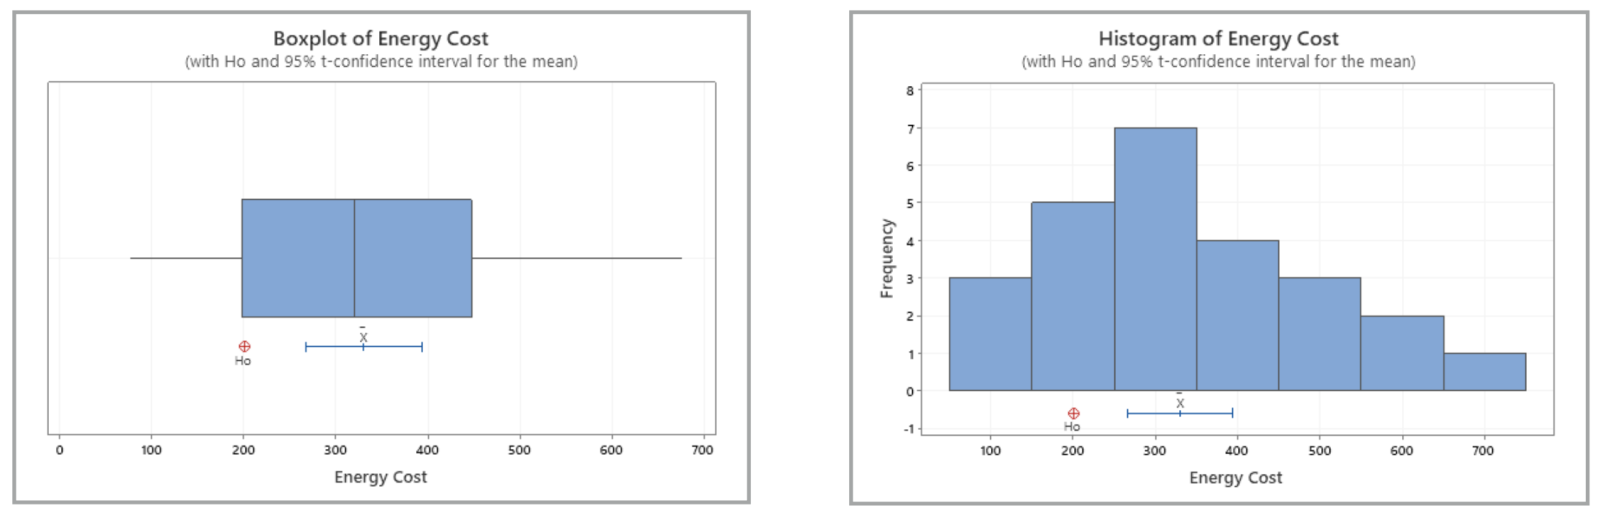
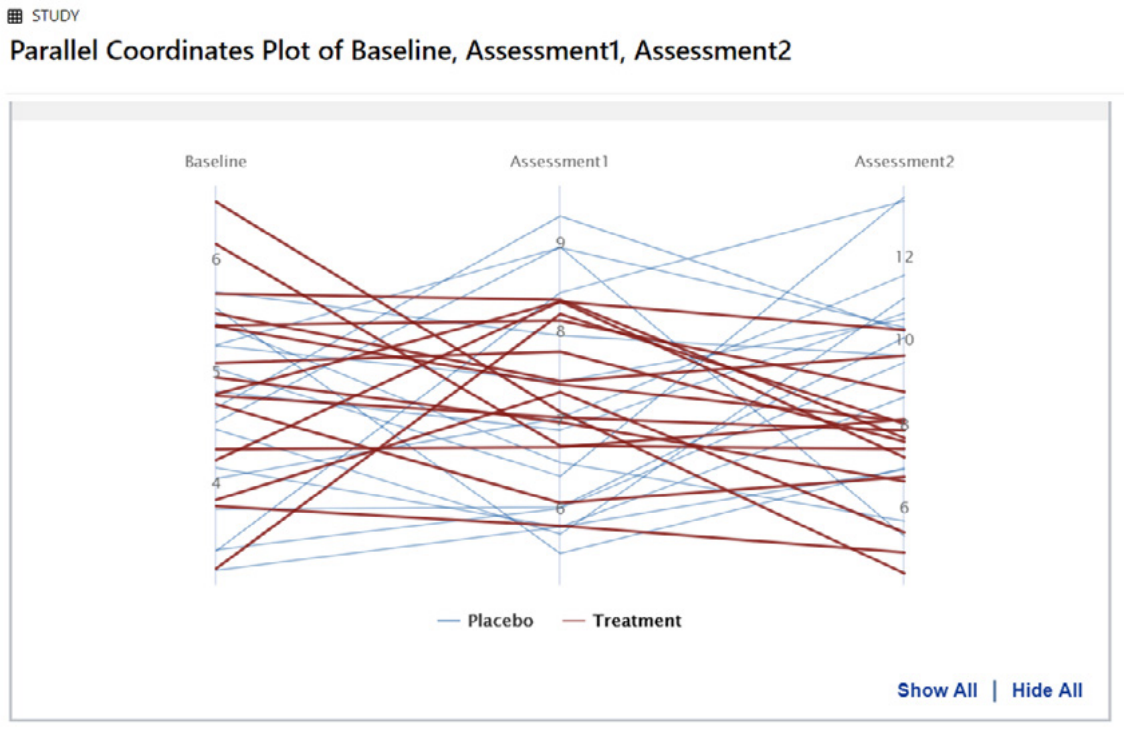
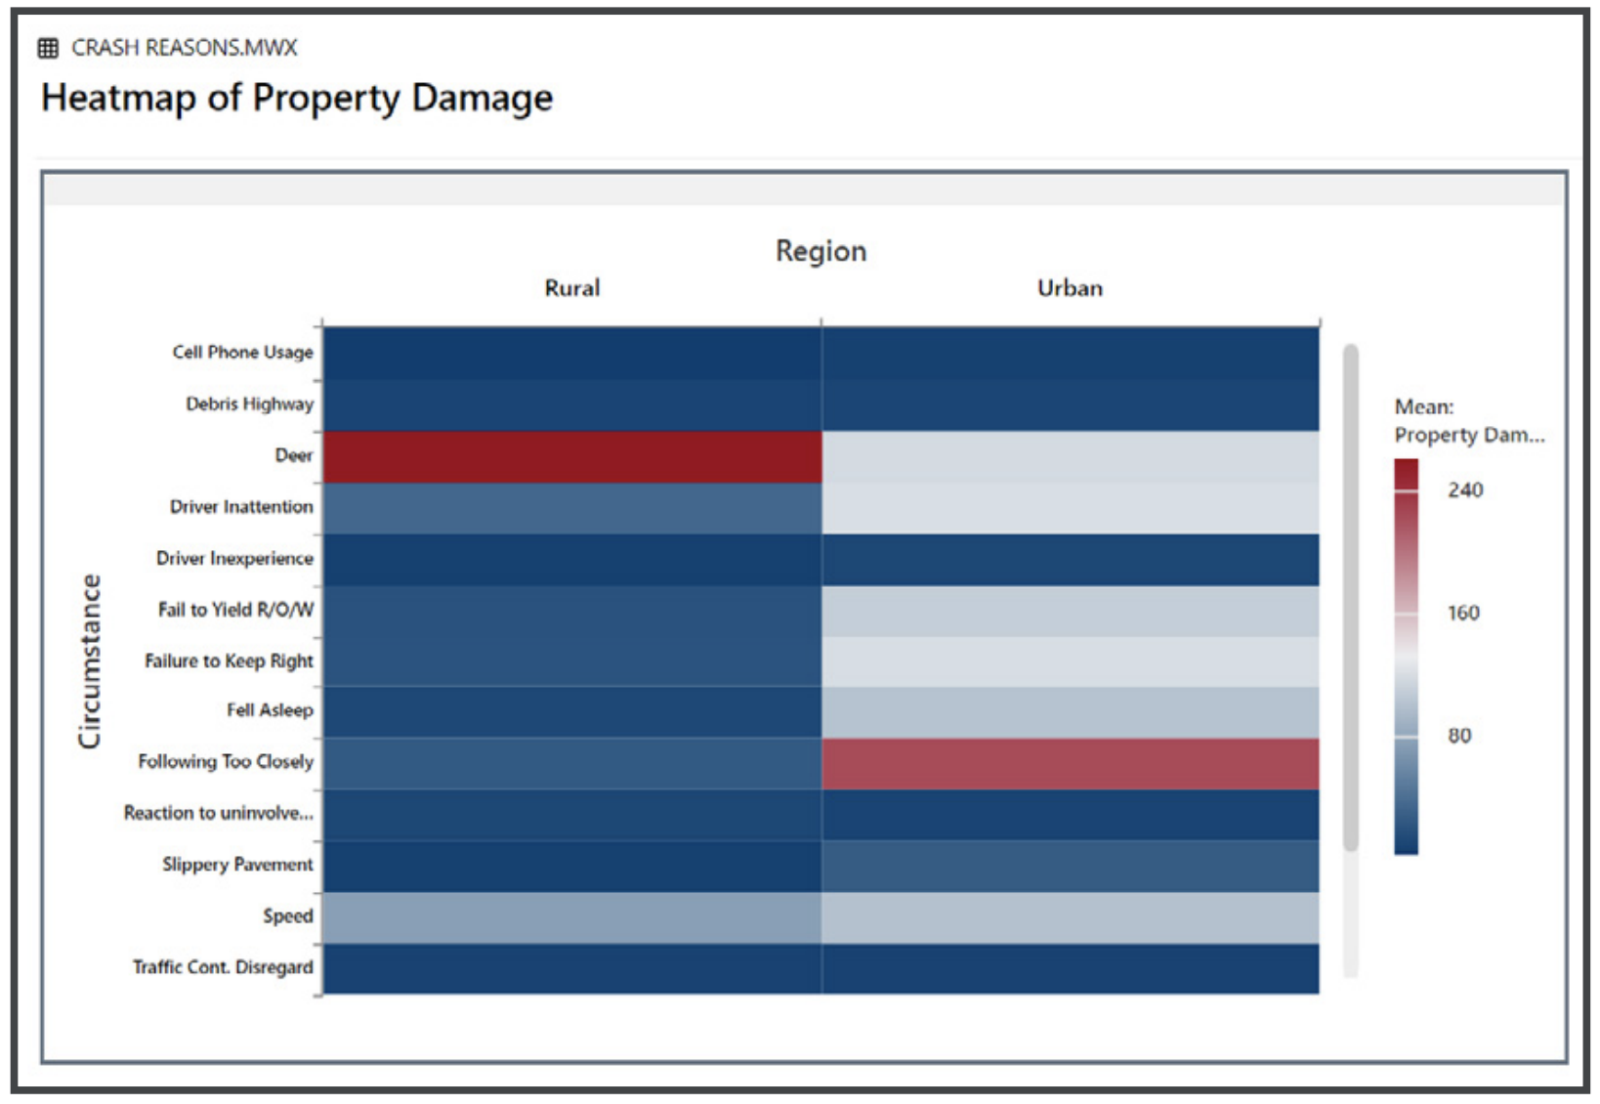
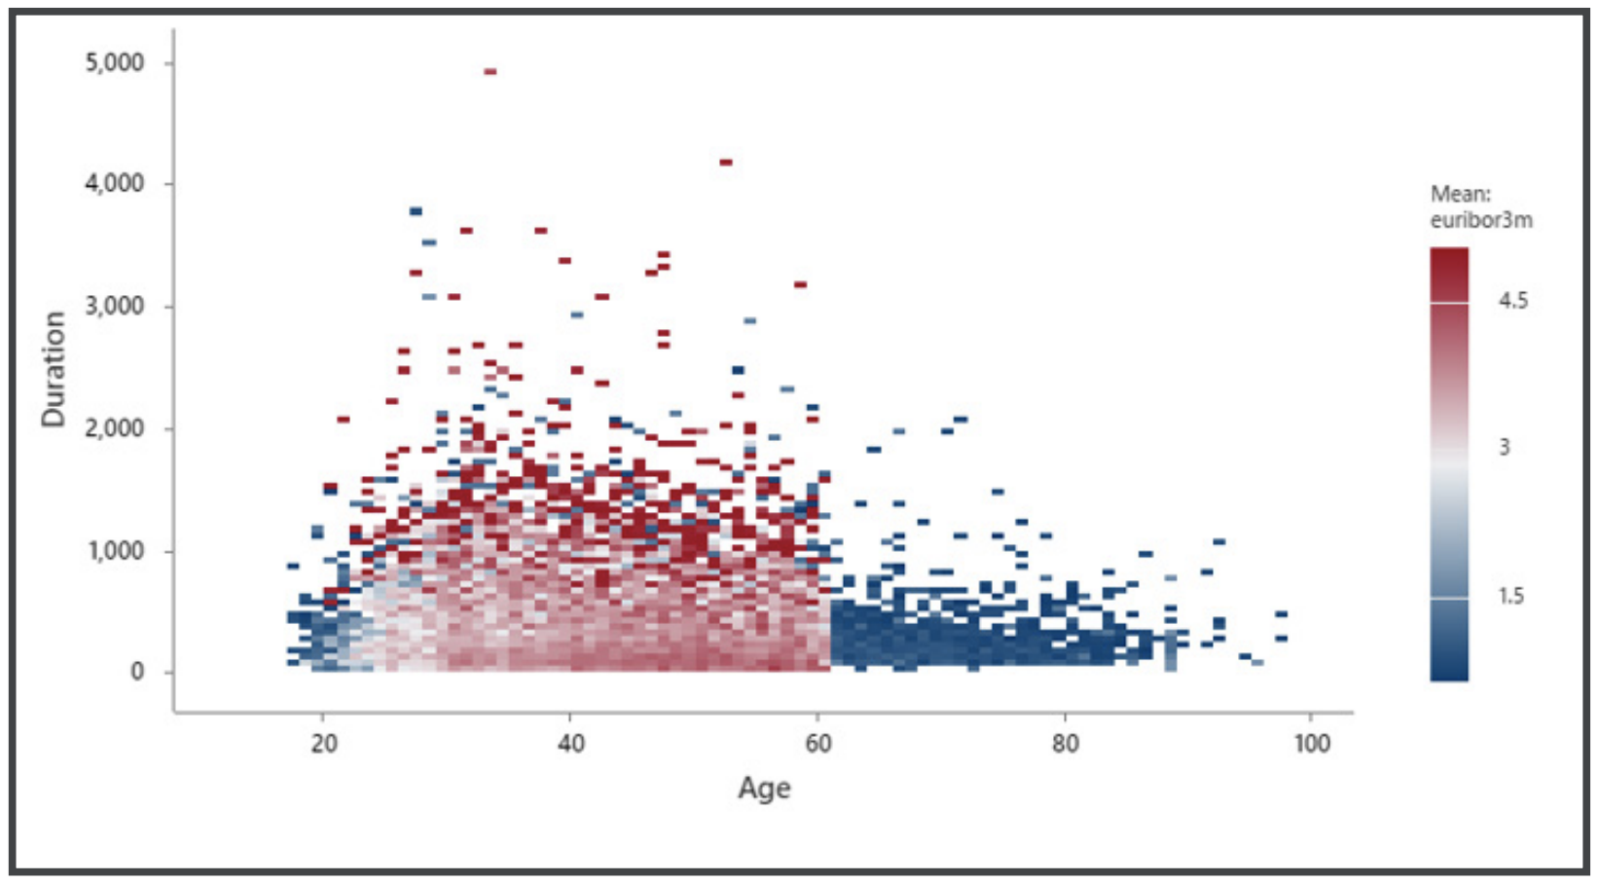
- Communicate Insights with Ease Visually share your findings and insights through scatterplots, binned scatterplots, bubble plots, boxplots, dot plots, histograms, heat maps, parallel plots, charts, time series plots and more.
- Modify, Share and Collaborate Seamlessly Graphs seamlessly update as data changes while Report and our new web app allow for real-time collaboration, secure analysis sharing and easy exporting with one-click to Microsoft PowerPoint, Microsoft Word, Minitab Workspace, and Companion by Minitab.
- Save Time Importing One-click import from Microsoft Excel, Microsoft Access and Minitab Connect means you don’t waste any time prepping before you start your analysis.
Seeing is believing. Put your data to work on your behalf with key visualizations you can create and share with lightning speed.
Minitab – your partner in your analytics journey:
Leverage comprehensive set of statistics for data analysis in your organization or role. Visualizations and the right statistical methods to enable data-driven decisions; and better decisions mean better business outcomes.
For Business Analytics:
Correlation Statistical Modeling;
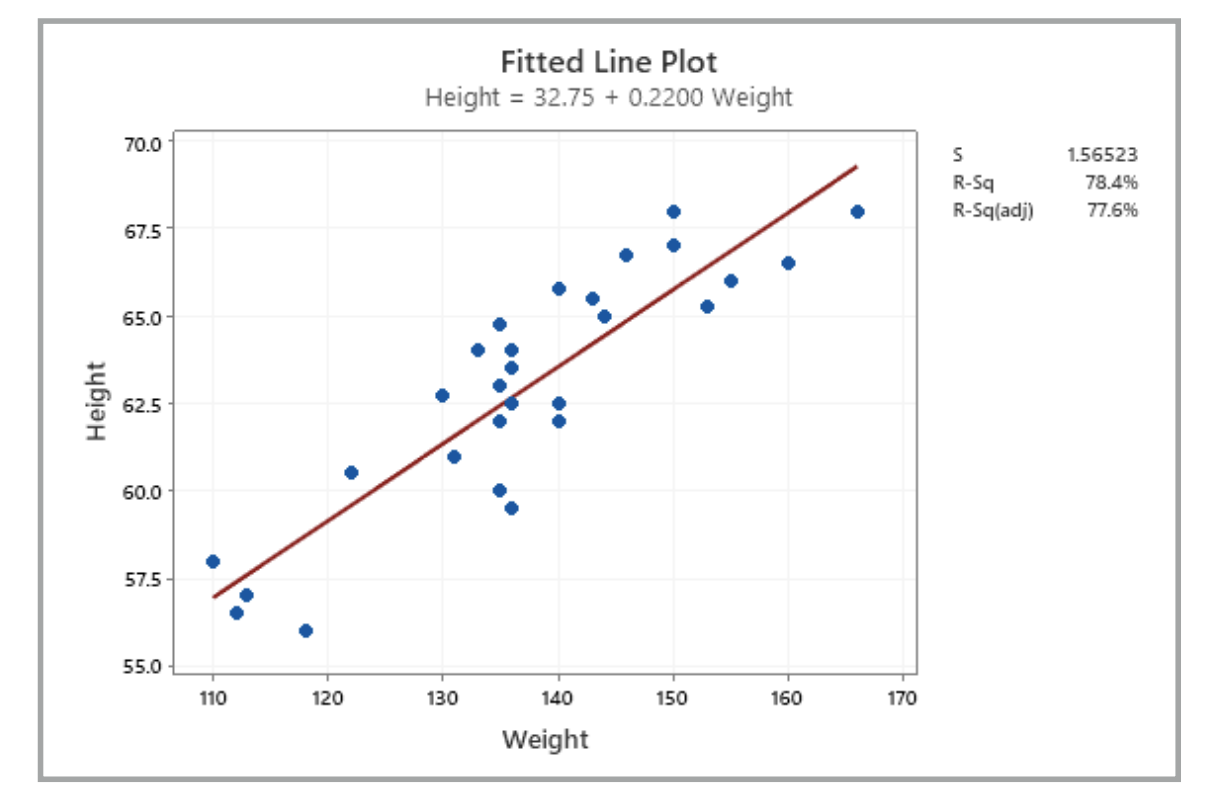
• Regression
• Non-linear regression
• Multivariate models
• Cluster analysis
Time Series Analytics;
• ARIMA modeling
• Time series / forecasting
Multivariate Methods Chi-Square Test for Association:
For Reliability Engineering:
Distribution Analysis
• Arbitrary censoring (left, right or interval censoring)
• Weibull analysis
• Censored data Warranty Analysis Repairable Systems Analysis Test Plans
• Demonstration
• Estimation (sample size for distribution analysis)
• Accelerated Life Test Regression with Life Data Probit Analysis
For Quality:
Measurement System Analysis
• Gage studies
• Attribute agreement analysis
Capability Analysis
• Capability Sixpack® – Quickly assess the assumptions for normal and non-normal capability analysis and focus only on the major indices of process capability
Control Charts
• Variable, attribute
• Multivariate
• Time weighted
• Rare event charts Acceptance Sampling Tolerance Intervals
For Process Validation:
Stage 1 Process Design;
• Measurement systems analysis
• Hypothesis testing
• Regression / ANOVA
• Process capability
Stage 2 Process Qualification;
• Control charts
• Capability analysis
• Tolerance Intervals
Stage 3 Continued Process Validation;
• Measurement systems analysis
• Acceptance sampling
• Control charts
For Product Development:
Design of Experiments (DOE);
• Screening designs
• Full factorial
• Fractional factorial
• Response surface
• Mixture Power Sample Size
Power Sample Size;
• Tolerance intervals
• Normal and non-normal distributions
If you need more information or assistance, please do not hesitate to contact us.