What are Biostatistical & Chemical Data Analysis Service
StatisticAnalysis.com we are a firm that you can trust for stellar biostatistical and Chemical consulting solutions. Whether you are a biological researcher or biotech drug developer, we can help! Not only do we have great experience and expertise in clinical trials, as we also specialize in epidemiological studies, biometry, and more.
.png)
Biostatistics is the centerpiece of every clinical study. It is a branch of statistics that are used to interpret scientific data generated in public health, biology, clinical medicine, proteomics, and other disciplines. With that, biostatistical support services involve the provision of quality statistical support and advice to researchers that need to prepare and/or implement clinical and translational projects and project proposals.
Statistical Programming and Data Analysis
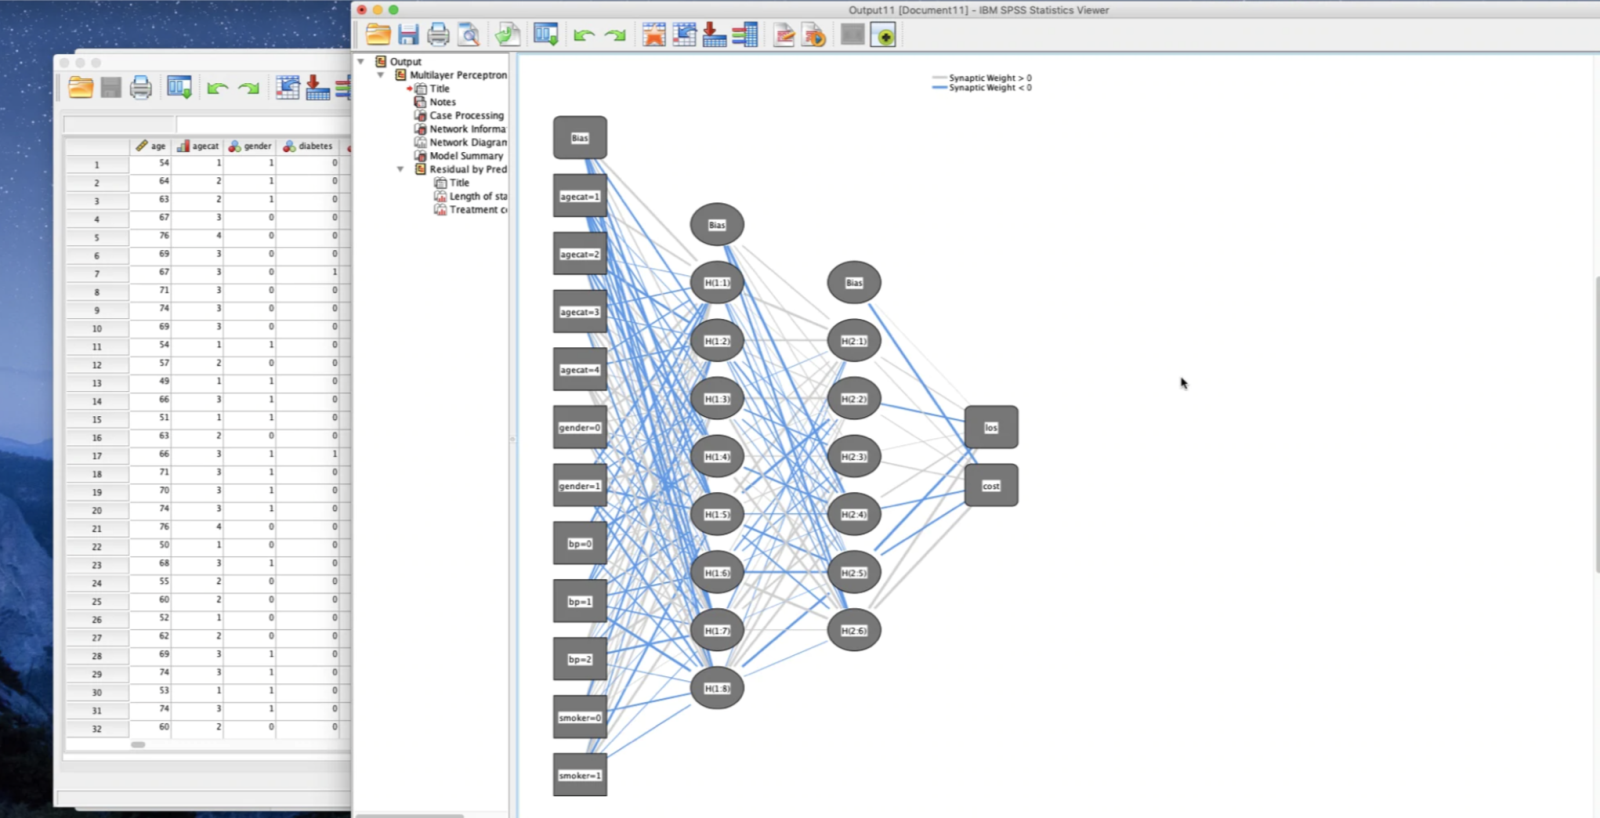
Once experimental data has been collected, data analysis can be performed and/or procedures demonstrated to those interested in performing the analysis themselves. Commonly used software includes SPSS, SAS, R and Stata. Other similar statistical software can be adopted in line with individual preferences. For individuals performing their own analysis a troubleshooting service is also available. The following are some statistical approaches that are commonly encountered.
- Standard hypothesis testing: T-tests, ANOVA, ANCOVA, Mann-Whitney U test, Wilcoxon signed-rank test, chi-squared analysis and survey analysis using various methods.
- Predictive models: Linear regression, logistic regression, polynomial regression, poisson regression, negative binomial ridge regression, lasso regression, ecologic regression, logic regression, probit, jacknife regression
- Latent variable models: PCA, Factor analysis, Common factor models, item response theory models, latent class model, structural equation models with latent variables.
- Partitioning methods: Hierarchical clustering, k-means clustering, medoid clustering, fuzzy clustering, and regression clustering.
- Generative models: Bayesian generative models, dynamic causal models, Markov models.
- Epidemiological analysis: Relative risk, odds ratio, incidence ratios, Cox regression, Kaplan-Meier curves.
- Meta-analysis: Meta analysis of means, proportions, correlated proportions or hazard ratios.
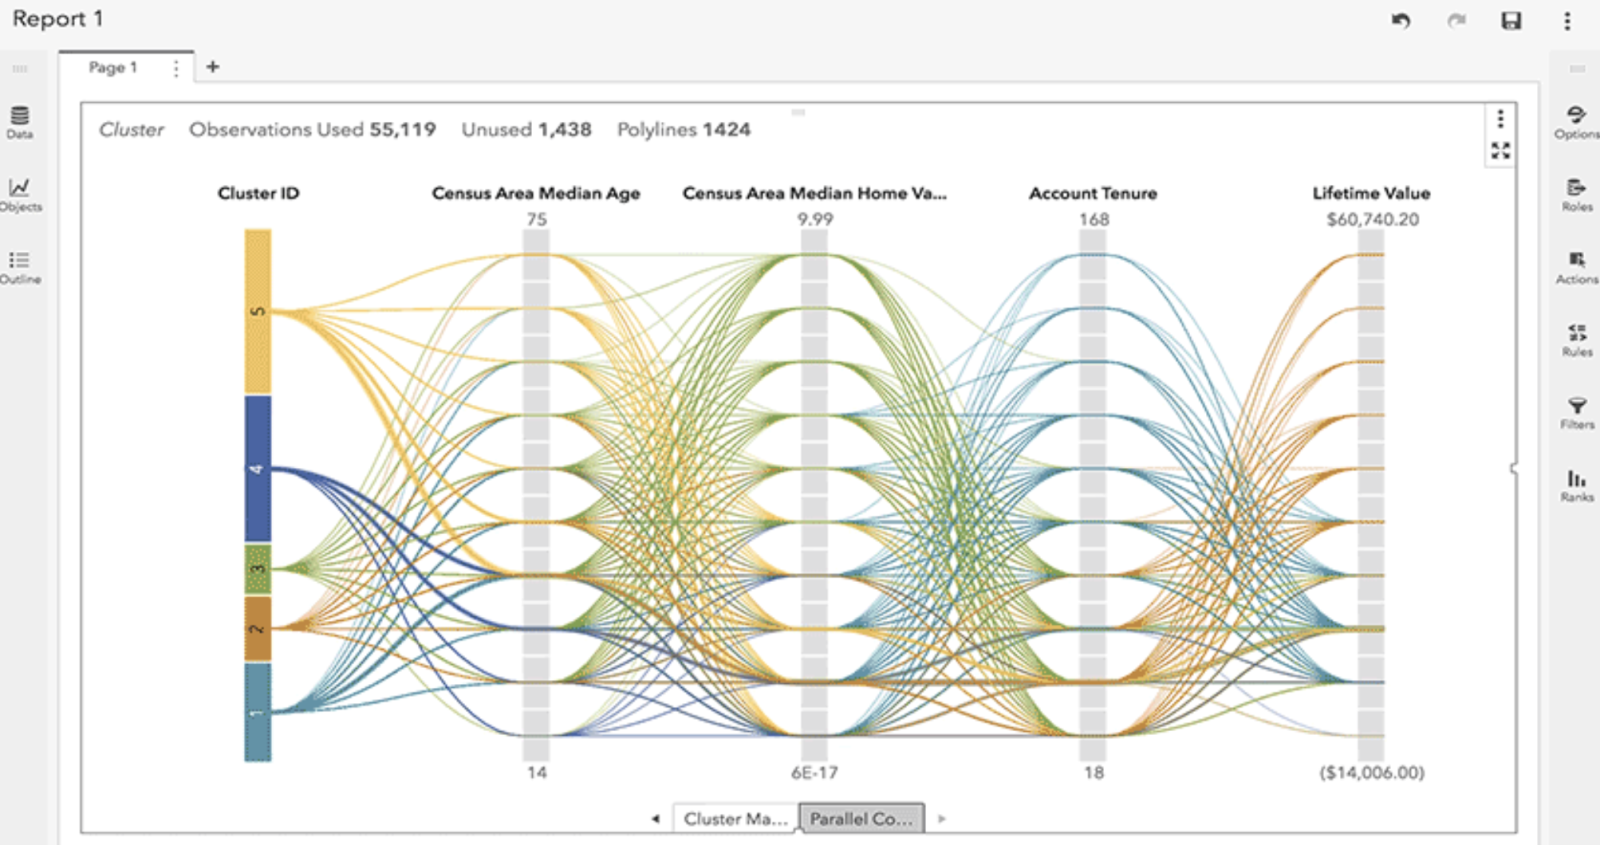
- Data Visualisation: Graphs and charts can be created using SPSS, SAS, Stata, Tableau, Qlikview or R Shiny.
Subscale for Biostatisticians
Survival analysis
Analyze duration outcomes—outcomes measuring the time to an event such as failure or death—using Stata's specialized tools for survival analysis. Account for the complications inherent in survival data, such as sometimes not observing the event (censoring), individuals entering the study at differing times (delayed entry), and individuals who are not continuously observed throughout the study (gaps). You can estimate and plot the probability of survival over time. Or model survival as a function of covariates using Cox, Weibull, lognormal, and other regression models. Predict hazard ratios, mean survival time, and survival probabilities. Do you have groups of individuals in your study? Adjust for within-group correlation with a random-effects or shared frailty model.
Multilevel mixed-effects models
Whether the groupings in your data arise in a nested fashion (patients nested in clinics and clinics nested in regions) or in a nonnested fashion (regions crossed with occupations), you can fit a multilevel model to account for the lack of independence within these groups. Fit models for continuous, binary, count, ordinal, and survival outcomes. Estimate variances of random intercepts and random coefficients. Compute intraclass correlations. Predict random effects. Estimate relationships that are population averaged over the random effects.
Bayesian analysis
Fit Bayesian regression models using one of the Markov chain Monte Carlo (MCMC) methods. You can choose from a variety of supported models or even program your own. Extensive tools are available to check convergence, including multiple chains. Compute posterior mean estimates and credible intervals for model parameters and functions of model parameters. You can perform both interval- and model-based hypothesis testing. Compare models using Bayes factors. Compute model fit using posterior predictive values. Generate predictions.
Power, precision, and sample size
Before you conduct your experiment, determine the sample size needed to detect meaningful effects without wasting resources. Do you intend to compute CIs for means or variances, or perform tests for proportions or correlations? Do you plan to fit a Cox proportional-hazards model or compare survivor functions using a log-rank test? Do you want to use a Cochran--Mantel--Haenszel test of association or a Cochran--Armitage trend test? Use Stata's power command to compute power and sample size, create customized tables, and automatically graph the relationships between power, sample size, and effect size for your planned study. Or, use the ciwidth command to do the same but for CIs instead of hypothesis tests by computing the required sample size for the desired CI precision. Instead of commands, use the interactive Control Panel to perform your analysis.
Linear, binary, and count regressions
Fit classical ANOVA and linear regression models of the relationship between a continuous outcome, such as weight, and the determinants of weight, such as height, diet, and level of exercise. If your response is binary, ordinal, categorical, or count, don't worry. Stata has estimators for these types of outcomes too. Use logistic regression to estimate odds ratios. Estimate incidence rates using a Poisson model. Analyze matched case–control data with conditional logistic regression. A vast array of tools is available after fitting such models. Predict outcomes and their confidence intervals. Test equality of parameters. Compute linear and nonlinear combinations of parameters.
Meta-analysis
Combine results of multiple studies to estimate an overall effect. Use forest plots to visualize results. Use subgroup analysis and meta-regression to explore study heterogeneity. Use funnel plots and formal tests to explore publication bias and small-study effects. Use trim-and-fill analysis to assess the impact of publication bias on results. Perform cumulative meta-analysis. Use the meta suite, or let the Control Panel interface guide you through your entire meta-analysis.
Multiple imputation
Account for missing data in your sample using multiple imputation. Choose from univariate and multivariate methods to impute missing values in continuous, censored, truncated, binary, ordinal, categorical, and count variables. Then, in a single step, estimate parameters using the imputed datasets, and combine results. Fit a linear model, logit model, Poisson model, hierarchical model, survival model, or one of the many other supported models. Use the mi command, or let the Control Panel interface guide you through your entire MI analysis.
Marginal means, contrasts, and interactions
Marginal means and contrasts let you analyze the relationships between your outcome variable and your covariates, even when that outcome is binary, count, ordinal, categorical, or survival. Compute adjusted predictions with covariates set to interesting or representative values. Or compute marginal means for each level of a categorical covariate. Make comparisons of the adjusted predictions or marginal means using contrasts. If you have multilevel data and random effects, these effects are automatically integrated out to provide marginal (that is, population-averaged) estimates. After fitting almost any model in Stata, analyze the effect of covariate interactions, and easily create plots to visualize those interactions.
Causal inference
Estimate experimental-style causal effects from observational data. With Stata's treatment-effect estimators, we can use a potential-outcomes (counterfactuals) framework to estimate, for instance, the effect of the mother smoking on the baby's birthweight or the effect of a drug on survival time after a heart attack. Fit models for continuous, binary, count, fractional, and survival outcomes with binary or multivalued treatments using inverse-probability weighting (IPW), propensity-score matching, nearest-neighbor matching, regression adjustment, or doubly robust estimators. If the assignment to a treatment is not independent of the outcome, you can use an endogenous treatment-effects estimator.
Epidemiological tables
Want to analyze data from a prospective (incidence) study, cohort study, case–control study, or matched case–control study? Stata's tables for epidemiologists make it easy to summarize your data and compute statistics such as incidence-rate ratios, incidence-rate differences, risk ratios, risk differences, odds ratios, and attributable fractions. You can analyze stratified data too—compute Mantel–Haenszel combined estimates, perform tests of homogeneity, and standardize estimates. If you have an ordinal rather than binary exposure, you can perform a test for a trend.
Programming
Want to program your own commands to perform estimation, perform data management, or implement other new features? Stata is programmable, and thousands of Stata users have implemented and published thousands of community-contributed commands. These commands look and act just like official Stata commands and are easily installed for free over the Internet from within Stata. A unique feature of Stata's programming environment is Mata, a fast and compiled language with support for matrix types. Of course, it has all the advanced matrix operations you need. It also has access to the power of LAPACK. What's more, it has built-in solvers and optimizers to make implementing your own maximum likelihood, GMM, or other estimators easier. And you can leverage all of Stata's estimation and other features from within Mata. Many of Stata's official commands are themselves implemented in Mata.
Python integration
Interact Stata code with Python code. You can interchange data between Stata and Python and pass results from Python back to Stata. You can call Python libraries such as NumPy, matplotlib, Scrapy, scikit-learn, and more from Stata.
Survey methods
Whether your data require a simple weighted adjustment because of differential sampling rates or you have data from a complex multistage survey, Stata's survey features can provide you with correct standard errors and confidence intervals for your inferences. Simply specify the relevant characteristics of your sampling design, such as sampling weights (including weights at multiple stages), clustering (at one, two, or more stages), stratification, and poststratification. After that, most of Stata's estimation commands can adjust their estimates to correct for your sampling design.
Automated reporting and dynamic document generation
Stata is designed for reproducible research, including the ability to create dynamic documents incorporating your analysis results. Create Word or PDF files, populate Excel worksheets with results and format them to your liking, and mix Markdown, HTML, Stata results, and Stata graphs, all from within Stata.
Our Solutions
Biostatistical and chemistry Analysis report provides statistical consulting services designed to take complex statistical analyses and translate their results into clear and meaningful conclusions for research and biotechnology institutions as well as drug development companies.
What do customers get?
- Protocol design and development
- Data management
- Statistical Analysis Plan (SAP)
- Statistical Tables and Figures
- Data analysis and Reporting
-
Statistical Analysis Reports (SAR)
-
Analysis Dataset Development and Data Cleaning
What do we need from customers?
- A short description of the study and the research methodology used for capturing the data.
- Raw data.
- Instructions for the expert and references to any published papers.
Get Your Statistic Solution
How It Works

Submit Statistic Project
Indicate the instructions, the requirements and the deadline of your project in the order form. Attach the files if needed.

Make a Payment
Once you agree with the offered price, you need to proceed with the payment. All payments are processed through PayPal, which secures a safe transaction.

Get Quality Solutions
As soon as your analysis report is ready, you will receive an email notification with an original of your solutions in the attachment.
Why Choose Us?

Quality
All of the analyses & reports you order from us are written from scratch by subject matter experts and quality-approved by our in-house editors before delivery.

Timely Delivery
Timeliness is a huge priority of our custom analysis and reporting service. We value your personal time and the need for timely completion.

Free Revision Right
We guarantee all of your requirements will be fulfilled.If for any reason, you feel any of the requirements were not met, we are ready to revise your order.

Statisticians
Our team comprised of Doctorate and Master’s Degree in statistics fields. Experienced statisticians committed to deliver high-quality solutions.
SUBMIT YOUR PROJECT NOW!
Fill Form with statistic project requirements and get a reasonable and competitive price quote