What is SPSS ?
6 May 2018
SPSS (Statistical Package for the Social Sciences), also known as IBM SPSS Statistics, is a software package used for the analysis of statistical data.
The software package was created in 1968 by SPSS Inc. and was acquired by IBM in 2009. While the software was renamed to IBM SPSS Statistics, it is still commonly referred to as just SPSS.
Although the name of SPSS reflects its original use in the field of social sciences, its use has since expanded into other data markets. SPSS is commonly used in healthcare, marketing and education research.
The types of data analyzed using SPSS is widely varied. Common sources include survey results, organization customer databases, Google Analytics, scientific research results and server log files. SPSS supports both analysis and modification of many kinds of data and almost all formats of structured data. The software supports spreadsheets, plain text files and relational databases such as SQL, SATA and SAS.
SPSS provides data analysis for descriptive and bivariate statistics, numeral outcome predictions and predictions for identifying groups. The software also provides data transformation, graphing and direct marketing features.
The software interface displays open data similarly to a spreadsheet in its main view. With its secondary variable view, the metadata that describes the variables and data entries present in the data file are displayed.
With SPSS Statistics you can:
- Analyze and better understand your data, and solve complex business and research problems through a user friendly interface.
- Understand large and complex data sets quickly with advanced statistical procedures that help ensure high accuracy and quality decision making.
- Use extensions, Python and R programming language code to integrate with open source software.
- Select and manage your software easily, with flexible deployment options.
- SPSS Statistics is available for Windows and Mac operating systems.
Take a closer look at IBM SPSS Statistics:
.png)
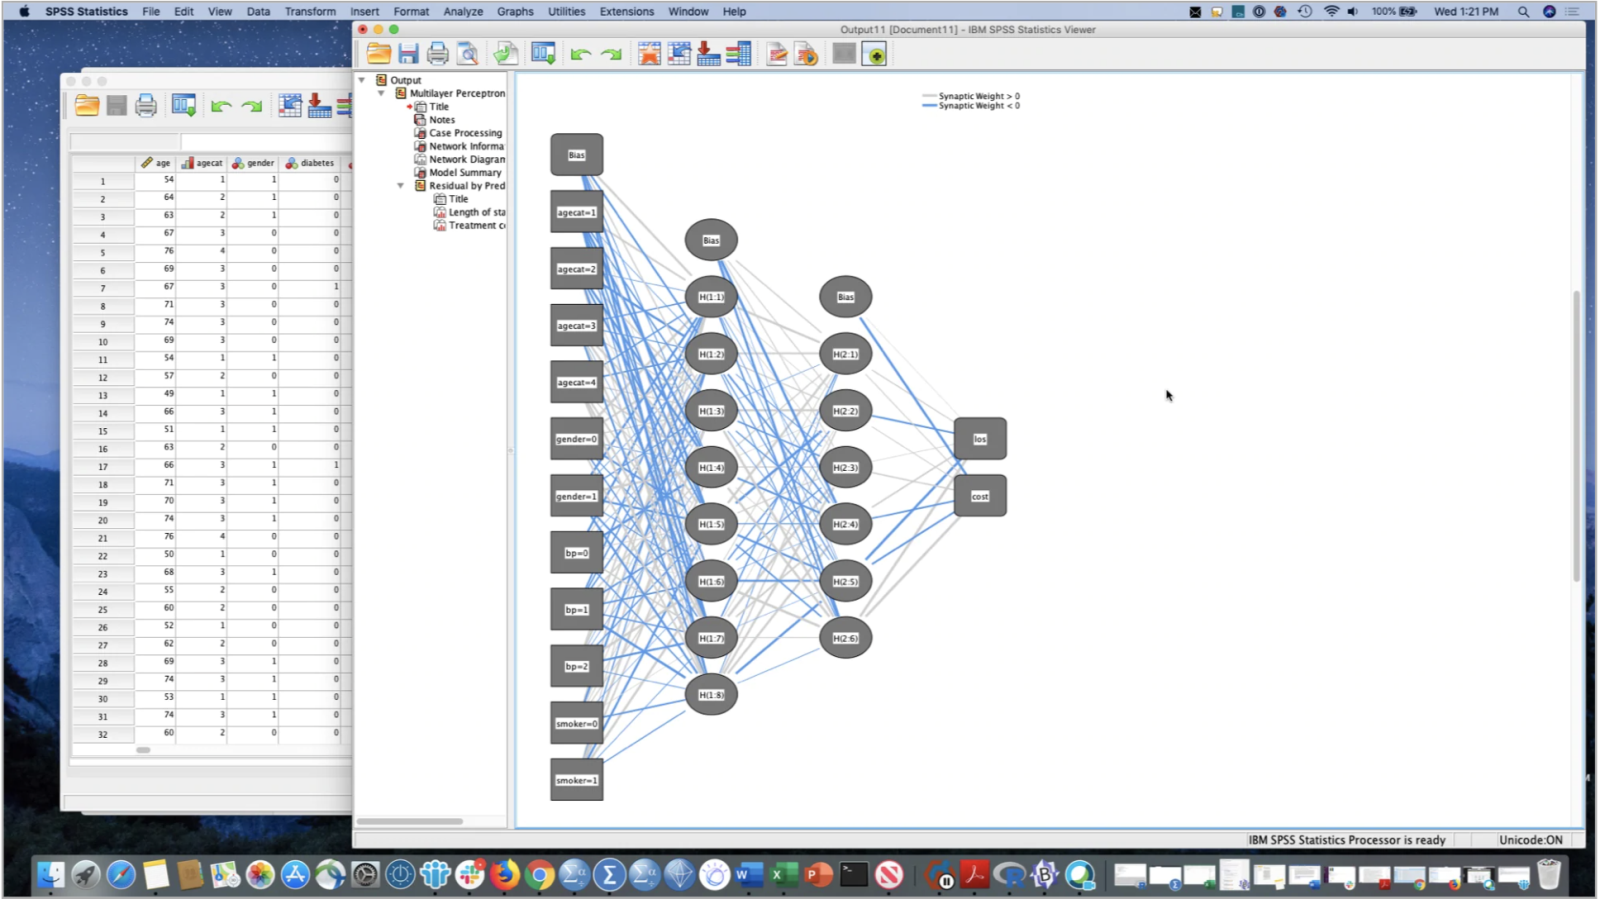
Multilayer Perceptron (MLP) Network-Tablo 1
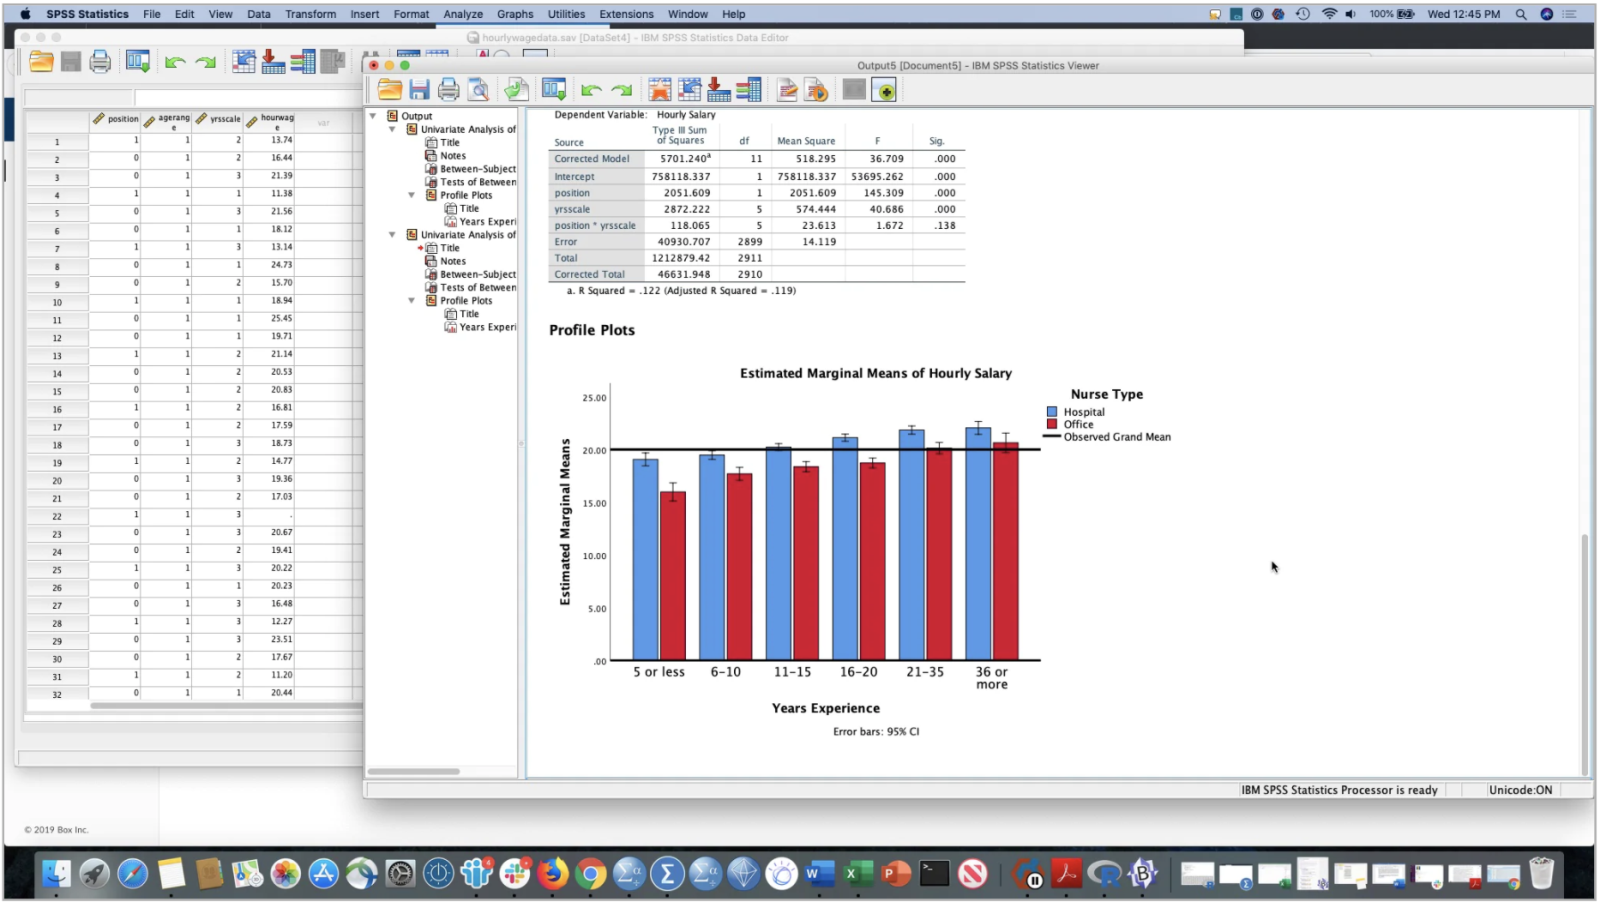
Estimated Marginal Means-Tablo 2
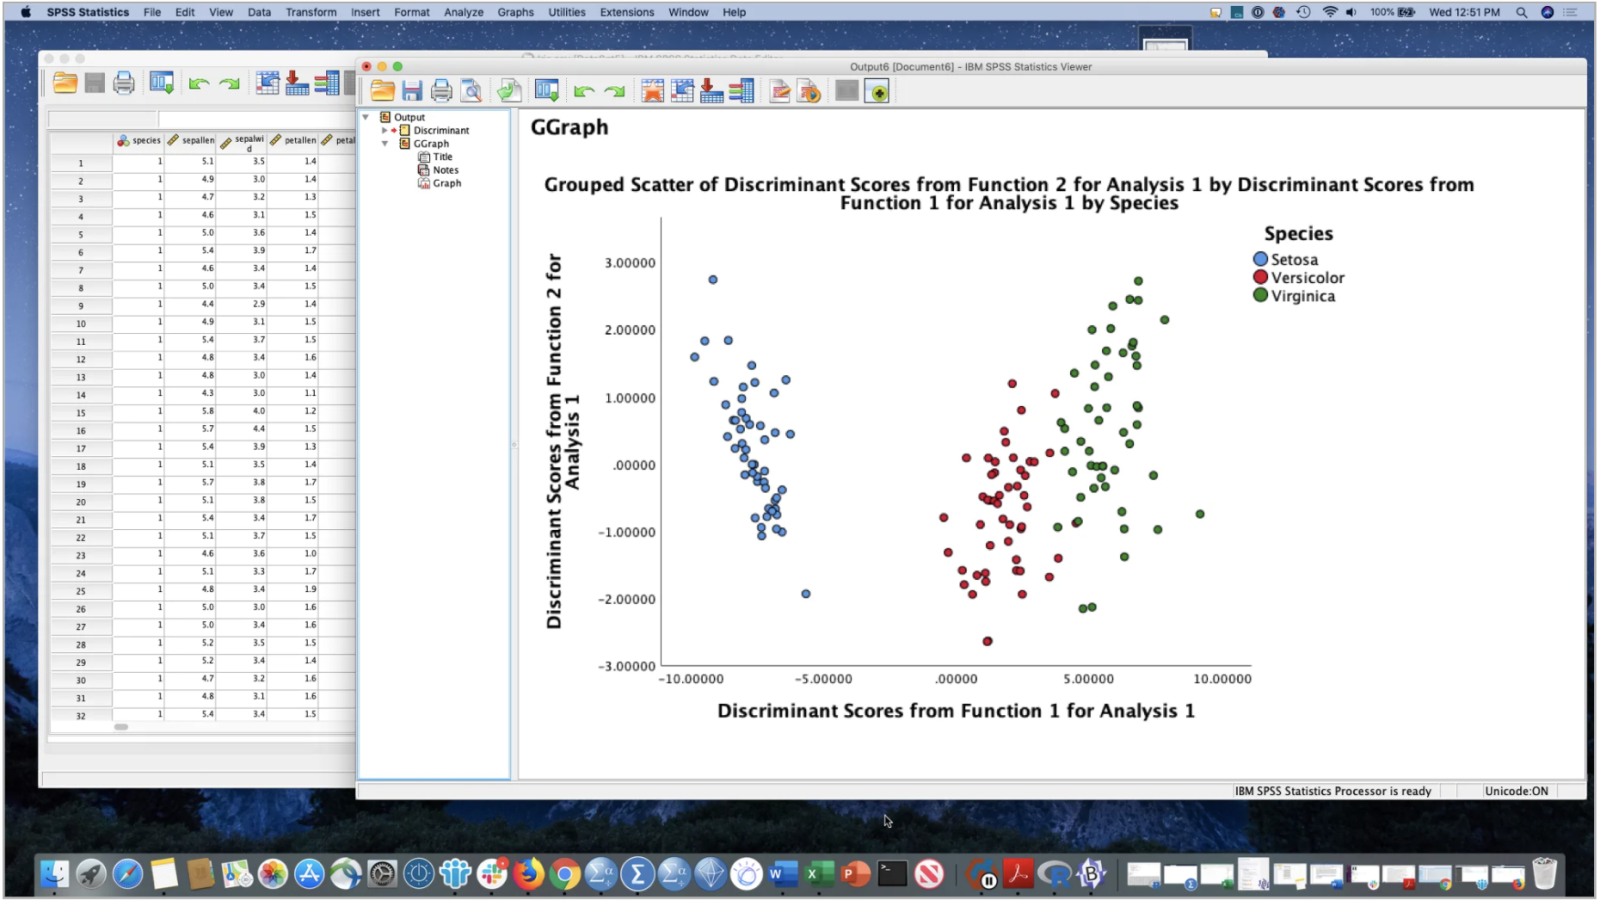
Discriminant scores scatter-Tablo 3
Bayesian Procedures- Tablo 4
Our professional experts use the key capabilities of IBM SPSS Statistics version 27. Your analysis reports are prepared using up-to-date software.
If you need more information or assistance, please do not hesitate to contact us.